
Several years ago I created a tool to help me estimate projects. It uses a Monte Carlo approach by taking your task list, estimated hours range, and your confidence in your own estimates. From those inputs it generates a series of possible outcomes to give you a sense of how long the project might take.
Quick History
At the time I created it I was struggling with the accuracy of the estimates I was doing. I was either underestimating because of optimism bias, or over estimating because I offset my bias too much.
The solution as startlingly effective. I used someone else’s ideas and built a basic tool and changed my behavior. That first version was enough to vastly improve my estimating ability, and give me a tool to help other team members think about their own. When I’ve been able to check estimate vs actual all but once I’ve been within on standard deviation of the mean (the “likely range” in that tool’s results).
A few years later I needed to estimate costs in addition to hours. So I created a second version which added cost projections to the process. That helped in a few scenarios, but honestly not as much as I’d hoped. Still, I learned stuff, therefore making it a useful exercise. Mostly it got to me fix some old bugs, and add scatter plot graphs to deal with complex outputs.
Those versions were driven purely by hour range estimates. They were extremely useful in helping me improve my estimates, if limited in estimating approach.
Time To Add New Approaches
Now I work on a team that estimates with Fibonacci story points and t-shirt sizing. I need my tool to support those approaches.
So over the last few weeks I’ve done more updates and upgrades. I now have a new version that will let you estimate using either of those techniques. It automatically converts those estimates to day ranges and runs the same simulations as it did before.
New Options
My experience is that teams using Fibonacci estimates, story points, or t-shirt sizing are usually estimating in days. Calendar time, or business days, are often what matters to product teams or in house teams.
Consultants track billable hours. In house teams hit a deadline.
To give users control over the conversion between the raw inputs and the day ranges the tool offers two modes. Which mode is best depends on what you’re doing, how you team works, and how well you track productivity now.
The first is a simple points to days conversion that takes maps the Fibonacci number to a number of days. It is labeled “Calendar Days” and lets users control the mapping. This approach is better for long-term estimation covering months or more.
The second mode is for teams that are good at measuring their velocity for agile methodologies. This mode let’s users specify a number of points per sprint, and the length of a sprint. It uses those factors to determine the number of points per day, and converts from there. This approach is better for shorter term estimate cover a few sprints.
Other Updates
While I was doing those updates I addressed a few other long standing issues. Older versions lacked feedback that a simulation was running. I also fixed several accessibility issues, improved test coverage, and added line item results summaries. The ReadMe file is now far more complete with better descriptions of process and more instructions.
Importantly, I changed the behavior for under-run estimates. Previously 50% of the time when the simulated value was outside the range provided it would pick a number below the specified range. Now that happens only 25% of the time, the other 75% generate numbers above the range. It also uses a calculation similar to the existing overestimate approach – the lower your confidence the wider a range it uses. This greatly reduces the number of 0 hour/day tasks in the simulations. It also changes the typical graph shape a bit to long-tail more on the high side. I think that is likely more realistic for most projects.
Welcome Our New AI Overlords
To accelerate the updates I used Copilot to help draft and review the code. AI coding still feels like cheating, but it is far faster. The code new is a bit sloppier in spots than I’d like and required several rounds of revisions at times. However, the AI added a lot of speed and reduced research level for new features. That saved time meant I added polishes I’ve been thinking about for years, but never took the time to do.
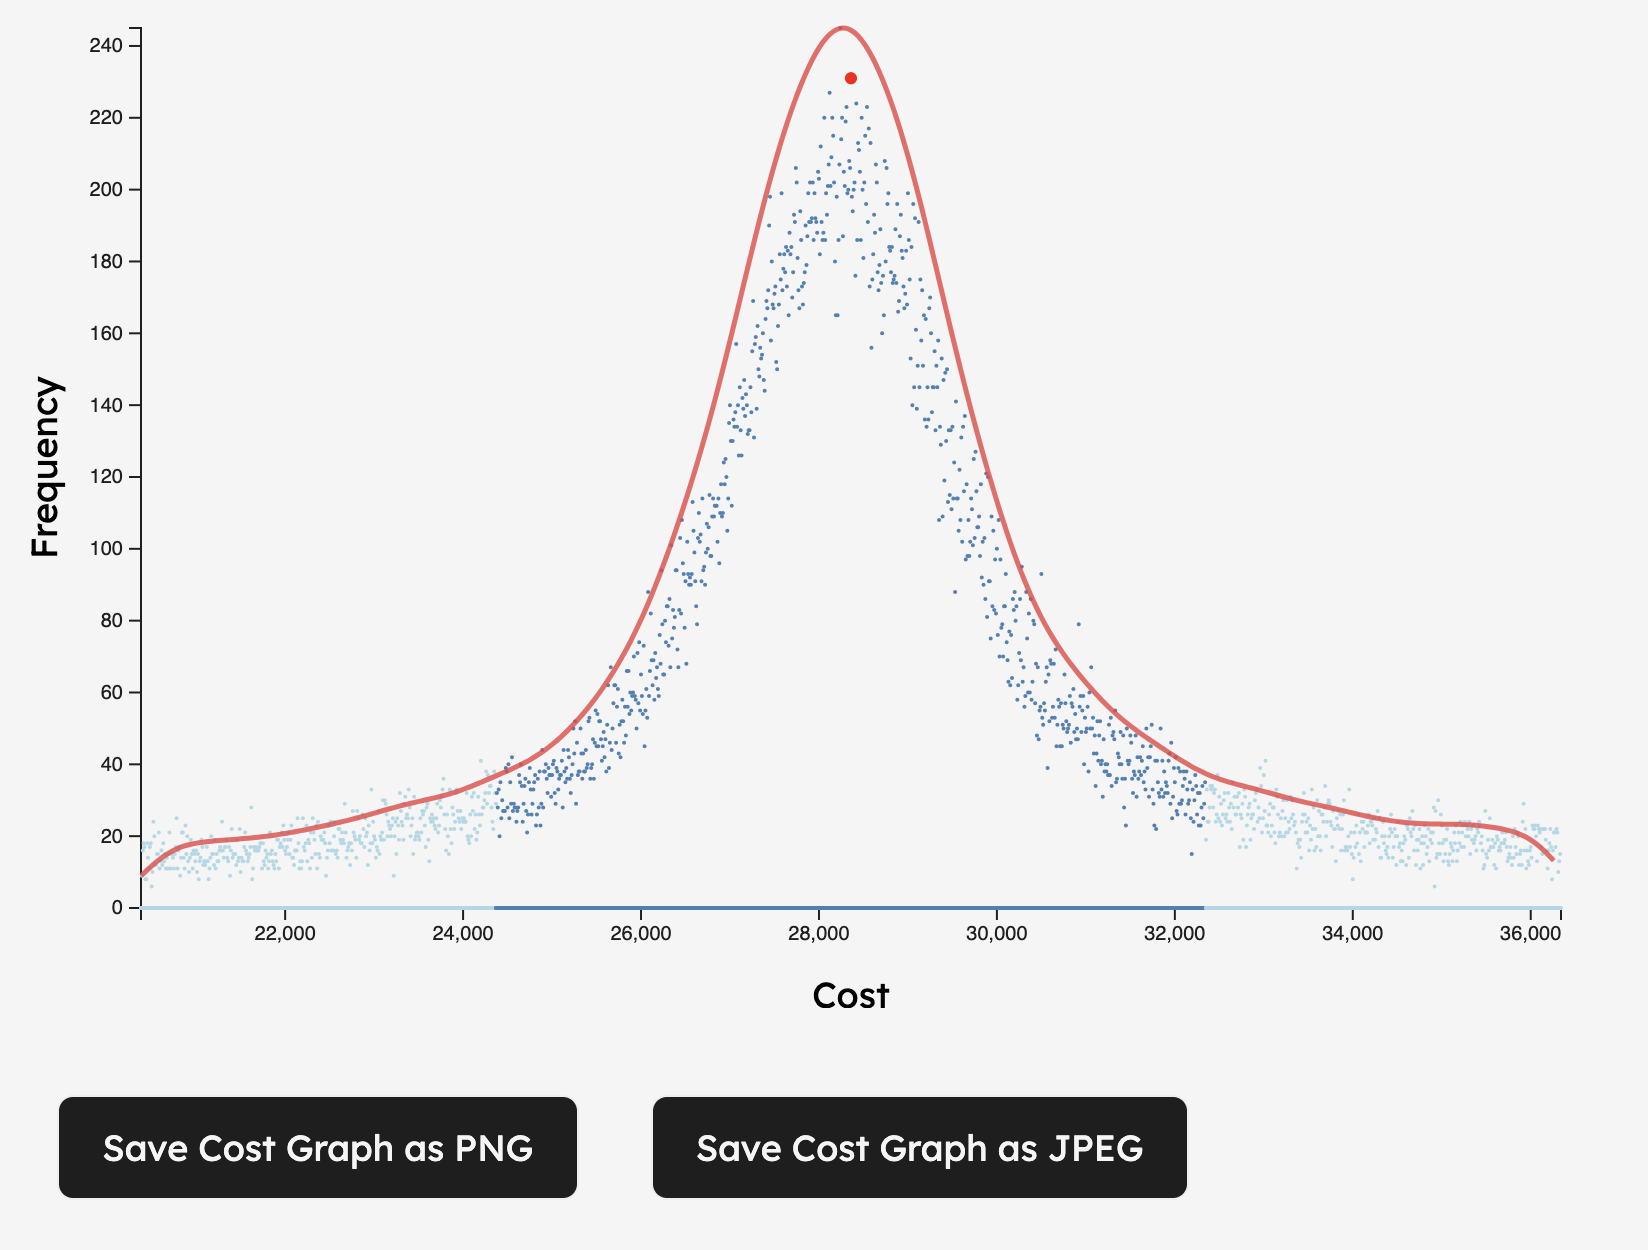
For example the tool now outlines scatter plots using a kernel density estimate curve. I added save buttons for the images, and there are print styles that make it easy to print into a PDF. Hopefully all those changes will make it easier to share the results. I only bothered to make those changes because AI made it easy to add them.
That process was aided by having had a reasonably good structure to the code I wrote in earlier editions.
And I did check all the new work, but keeping tabs on 200 lines of new code from one prompt is a challenging exercise at times.
The code base needs some additional refactors still to deal with some of the bloat it picked up.
I don’t care that Claude and Copilot assure me all cleanup already been handled, the 2000 line index.js tells me otherwise.
You can find the full code my estimation tool on Github. If you have suggestions, please open an issue there and we can discuss it.