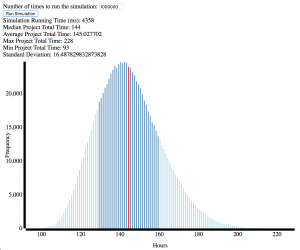
A few years ago I wrote a piece about project time estimation and created an estimating tool. My goal was to get project managers to listen to the fact that estimates were inherently a guess not promise. The tool I created took a series of project tasks, the estimated time range, and a level of estimator confidence. It then ran a Monte Carlo simulation with those tasks, and generated a histogram of possible outcomes.
Five years later I still use it for project estimates. But I have grown tired of its interface weaknesses and needed to add cost estimation to keep it useful. So I recently heavily revised the tool and posted an updated version (the old version is still available here).
The interface is still very utilitarian ( pull requests welcome), but this version makes it make easier to adjust the tasks. Much more importantly it now also estimates costs, not just time.
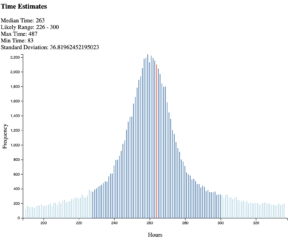
The new version is faster than the previous. And it adjusts the graph type based on the range of possible outcomes.
Each task now includes inputs for min and max time, confidence, and hourly cost of that task. So if different people at different bill rates are part of the project it can still give you useful numbers.
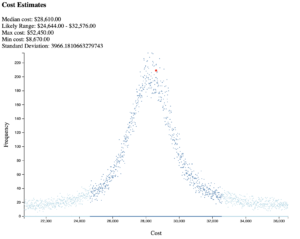
The histograms broke down when faced with too many bars. So I settled on an XY scatter approach to help visualize the broader range that the cost estimator made normal.
Please give it a try, I’m always open to feedback, suggestions, and pull requests.
Costs Estimates
For this version I added the ability to include a unit cost for each task. The first tool worked just fine when you were estimating the tasks for one person who had one billing rate (or where hourly costs aren’t important). In practice teams need to be to able to do an estimate across all work streams, and different roles will have different billing rates.
This version includes a rate for each task and a graph of projected project costs.
Why I Created A Project Estimator
I wrote the original when I was struggling with project managers who would take any estimate you gave them as a range, pick a number, and promise the client (and themselves) we would hit it. To them an estimate was a promise – one that had to be kept. That lead me to badly overestimate projects so that the lowest end of my range would be a safe number – but that’s just a different form of bad estimation.

I had a good amount of experience providing estimates, and had read a lot on the topic. I knew there were teams that did better and I wanted to help our team improve.
The original tool was loosely inspired by one Joel Spolsky described ten years earlier. He has several important ideas on his process regardless of your project methodology. But his idea of using Monte Carlo simulations had stuck with me since that article had been new. After failing to find a tool that included it, I wrote my own.
Are the Project Estimates Any Good?
Fundamentally the simulations are only as good as the estimates provided. For any project I have been able to compare my simulated project estimates to final hours my work fell within one standard deviation of the median.
The confidence measure helps more than I expected. Originally, I added the measure of confidence because I needed something to determine how often the simulator should assume people are just plain wrong – and by how much. While I could have hard coded a solution I did not know how to pick good values. I knew that my confidence varies by the task. I also knew the less confident I am the more I am likely to be wildly off. So decide to make confidence an estimator provided variable, and use that to pick the size of overruns.
For every 10% you reduce the confidence, the simulation will allow the upper bound of the estimate to increase by the size or the entered upper bound. On a task you estimate at 7-10 hours, a 90% confident estimate will allow overruns up to 20 hours (just in the 10% of times that aren’t in the 7-10 range), and 30 hours for an 80% estimate.
That extra box also immediately helped me feel comfortable with my estimates. Knowing that the simulator would offset optimism bias for me I could stop trying to do that myself. My estimates can use tighter ranges trusting the software to offset expected bias.
A Value of the Graphs in Project Estimates
The graph has turned out to be the most important feature. Initially I included it because I wanted to play with D3 and have something more impressive than numbers to show. What I discovered was a reminder of the importance of data visualizations – even simple ones.
As I said before I created this tool when working with project managers who simplified all estimate ranges to a single number and held everyone to that number. The first time I presented numbers from the simulator those project managers picked the median and complained I made it too hard. The median was better than what we had before, but not enough to treat as a promise.
When I started presenting the graph those same people immediately started to change how they talked about the project. By visualizing the impact of uncertainty over several tasks they could see that the project might run far over my estimate – or far under. The more uncertainty, the longer the tail on the graph.
Suddenly they were comfortable talking about risks from overruns, finding ways to help clients understand the possible risks, and being understanding when a task proved harder than expected.
The graphs tell the story, and empowers the team to have an honest and productive about project estimates.

